Overview of Power BI Desktop
Power BI Desktop is an application that you download and install for free on your local computer. Desktop is a complete data analysis and report creation tool that is used to connect to, transform, visualize, and analyze your data. It includes the Query Editor, in which you can connect to many different sources of data and combine them (often called modeling) into a data model. Then you design a report based on that data model. Reports can be shared with others directly or by publishing to the Power BI service. The Power BI Desktop getting started guide walks through the process.
The Power BI service is a cloud-based service, or software as a service (SaaS). It supports report editing and collaboration for teams and organizations. You can connect to data sources in the Power BI service, too, but modeling is limited. The Power BI service is used to do things such as creating dashboards, creating and sharing apps, analyzing and exploring your data to uncover business insights, and much more. What is the Power BI service details many of the capabilities of the Power BI service.
Most Power BI report designers who work on business intelligence projects use Power BI Desktop to create Power BI reports, and then use the Power BI service to collaborate and distribute their reports.
The Power BI service also hosts paginated reports in workspaces backed by a Power BI Premium capacity. You create paginated reports with Power BI Report Builder. See Compare Power BI reports and paginated reports in the article “What are paginated reports in Power BI Premium?” for more information.
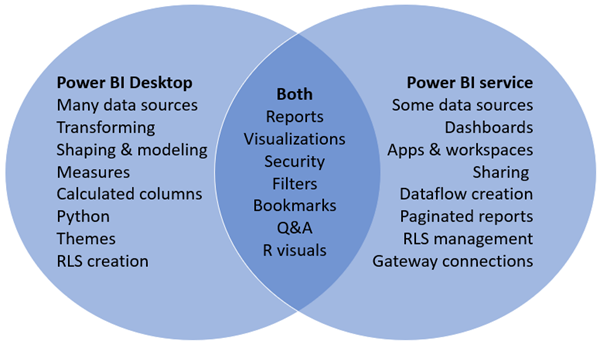
In a Venn diagram comparing Power BI Desktop and the Power BI service, the area in the middle shows some of the areas where the two overlap. Some tasks you can do in either Power BI Desktop or the service. The two outer sides of the Venn diagram show the features that are unique to either the Desktop application or to the Power BI service.
Editing Power BI reports
In both the application and the service, you build and edit Power BI reports. A report can have one or many pages, with visuals and collections of visuals. Add bookmarks, buttons, filters, and drillthrough, to enhance navigation in your reports.
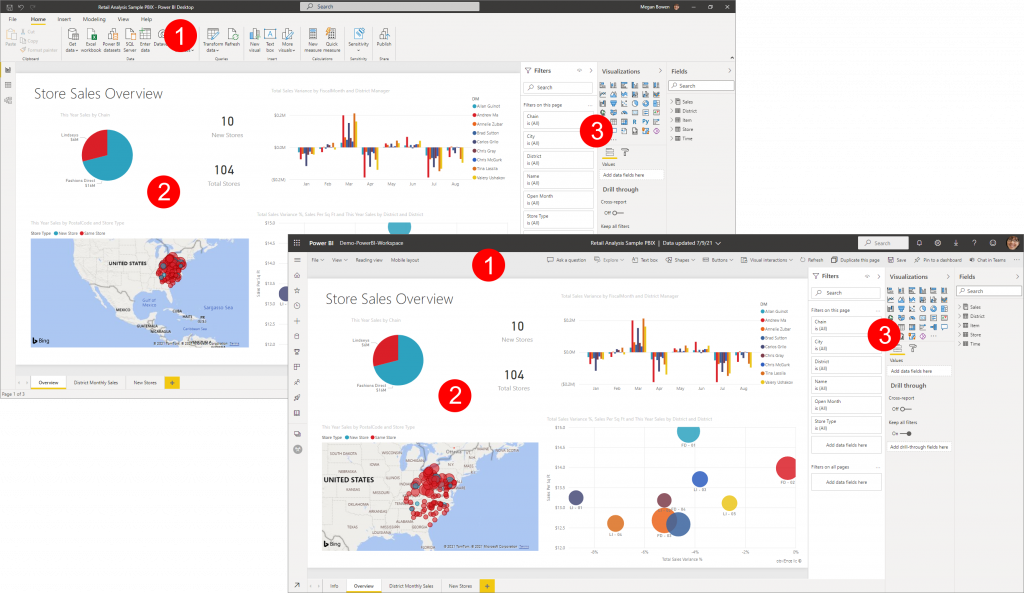
The report editors in Power BI Desktop and in the service are similar. They’re made up of three sections:
- The top nav panes, different in Power BI Desktop and the service
- The report canvas
- The Fields, Visualizations, and Filters panes.
This video shows the report editor in Power BI Desktop.
Working in the Power BI service
Collaborating
After you’ve created your reports, you can save them to a workspace in the Power BI service, where you and your colleagues collaborate. You build dashboards on top of those reports. Then, you share those dashboards and reports with report consumers inside and outside your organization. Your report consumers view them in the Power BI service in a Reading view, not Editing view. They don’t have access to all the features available to report creators. You can also share your datasets and let others build their own reports from them. Read more about collaborating in the Power BI service.
Self-service data prep with dataflows
Dataflows help organizations unify data from disparate sources and prepare it for modeling. Analysts can easily create dataflows, using familiar, self-service tools. Analysts use dataflows to ingest, transform, integrate, and enrich big data by defining data source connections, ETL logic, refresh schedules, and more.Read more about self-service data prep with dataflows.
What is Power BI Desktop?
Power BI Desktop is a free application you install on your local computer that lets you connect to, transform, and visualize your data. With Power BI Desktop, you can connect to multiple different sources of data, and combine them (often called modeling) into a data model. This data model lets you build visuals, and collections of visuals you can share as reports, with other people inside your organization. Most users who work on business intelligence projects use Power BI Desktop to create reports, and then use the Power BI service to share their reports with others.
The most common uses for Power BI Desktop are as follows:
- Connect to data.
- Transform and clean data to create a data model.
- Create visuals, such as charts or graphs, that provide visual representations of the data.
- Create reports that are collections of visuals on one or more report pages.
- Share reports with others by using the Power BI service.
People most often responsible for such tasks are often considered data analysts (sometimes referred to as analysts) or business intelligence professionals (often referred to as report creators). However, many people who don’t consider themselves an analyst or a report creator use Power BI Desktop to create compelling reports, or to pull data from various sources and build data models, which they can share with their coworkers and organizations.
Important: – Power BI Desktop is updated and released on a monthly basis, incorporating customer feedback and new features. Only the most recent version of Power BI Desktop is supported; customers who contact support for Power BI Desktop will be asked to upgrade to the most recent version. You can get the most recent version of Power BI Desktop from the Windows Store, or as a single executable containing all supported languages that you download and install on your computer.
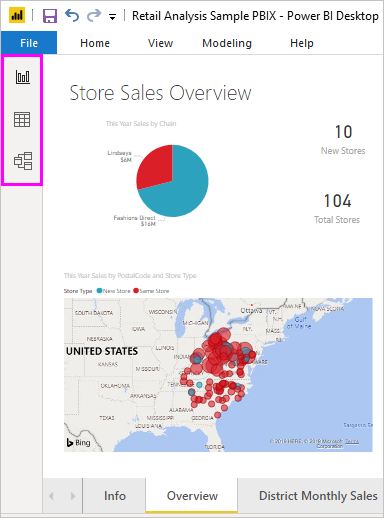
There are three views available in Power BI Desktop, which you select on the left side of the canvas. The views, shown in the order they appear, are as follows:
- Report: You create reports and visuals, where most of your creation time is spent.
- Data: You see the tables, measures, and other data used in the data model associated with your report, and transform the data for best use in the report’s model.
- Model: You see and manage the relationships among tables in your data model.
The following image shows the three views, as displayed along the left side of the canvas:
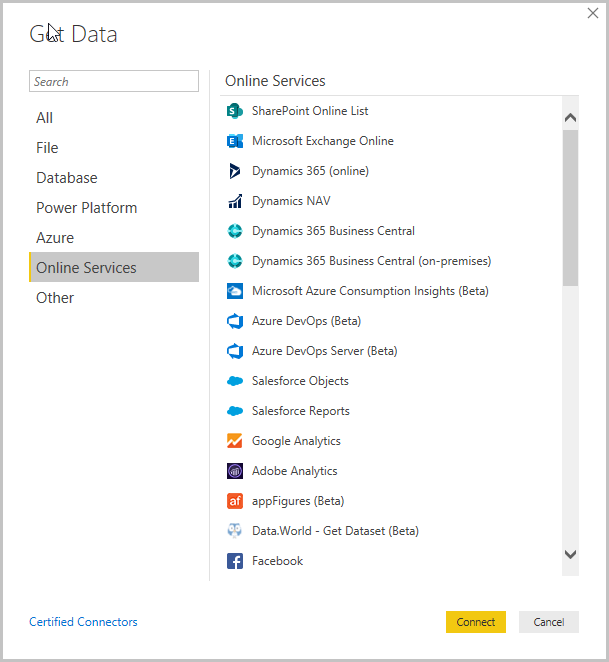
Connect to data
To get started with Power BI Desktop, the first step is to connect to data. There are many different data sources you can connect to from Power BI Desktop.
To connect to data:
From the Home ribbon, select Get Data > More.
The Get Data window appears, showing the many categories to which Power BI Desktop can connect.
Connect to data
To get started with Power BI Desktop, the first step is to connect to data. There are many different data sources you can connect to from Power BI Desktop.
To connect data:
From the Home ribbon, select Get Data > More.The Get Data window appears, showing the many categories to which Power BI Desktop can connect.
For more info – please book a free consultation now – Discovery Meetings (office365.com)
Leave a Reply