Power BI dashboard is a page collection of data visualizations used to show the highlights of the data. This blog will have a detailed description of the dashboards, why power BI is preferred over other BI tools, Power BI’s components, a brief comparison between Power BI reports and dashboards, applications of the dashboard, and how to create one in Power BI Desktop.
Why Power BI?
The following are the reasons why enterprises around the world prefer Power BI over other business intelligence tools:
- Easy to Connect with Data Sources: Power BI brings the data together by connecting with both on-premises and on-cloud data sources, such as Excel spreadsheets, CSV files, OneDrive, Salesforce, Azure Data Warehouse, Google Analytics, Dropbox, SQL Database, etc. Power BI connectors enable the user to analyze massive datasets within minutes.
- Custom Visualizations: Power BI offers prepacked visualizations such as lines, maps, bars, columns, graphs, Funnel, Charts, scatter plots, tables, and waterfalls. These visuals have customization options that enable the user to enhance the presentation and functionality of their dashboards.
- Native R Integration: Power BI supports R, an open-source programming language used for statistical modeling, machine learning, data manipulation, and visualization. Power BI lets the user integrate R and follow a drill-down approach to represent better relationships, patterns, hierarchies, and key matrices.
- Cortana Integration: Cortana is Microsoft’s digital assistant, which Power BI integrates with and allows the user to run voice commands in a natural language and access the dashboards. Visualizations can be created by writing the column name with the visual the user wants to add it in.
- Power BI Apps: The apps provide a glance at the dashboards and reports shared by other users. The user can embed their Power BI tiles in the applications to get live updates about their data on a mobile phone.
- User Interface: Power BI can be used by anyone with a basic knowledge of Excel. Even a nontechnical user can generate valuable information with the help of a Power BI sample dashboard. You can play with Power BI dashboard templates and add custom visualizations to extract maximum information.

What is Power BI Dashboard?
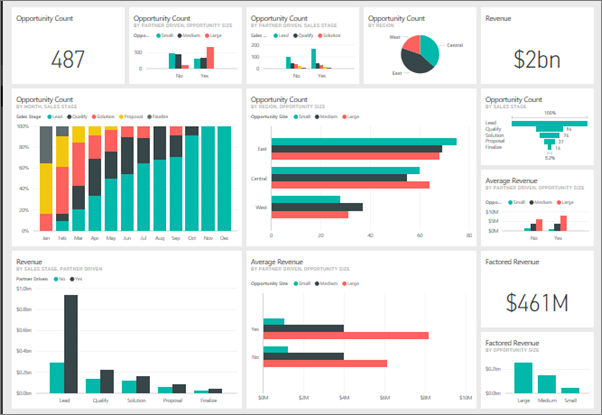
Power BI dashboard is a collection of data visualizations that tells a story through graphs and charts. Often called the canvas, dashboards are the single-page interface where the user can add custom visualizations, which gives the highlights of that story.
Power BI allows the user to create interactive dashboards by adding tiles to the interface. Tiles are the visualizations created by using two or more dimensions of the transformed data. A tile makes a dashboard look understandable and organized. It can either be a simple graph, or a complex and more informative visual such as a Power BI Heatmap.
You can share these dashboards on different platforms through Power BI Service, where others can view them and get a quick into the business. Moreover, you can add the dashboards on Power BI apps and websites to get the live feed on your smartphone, tablet, or computer.
What are Reports in Power BI
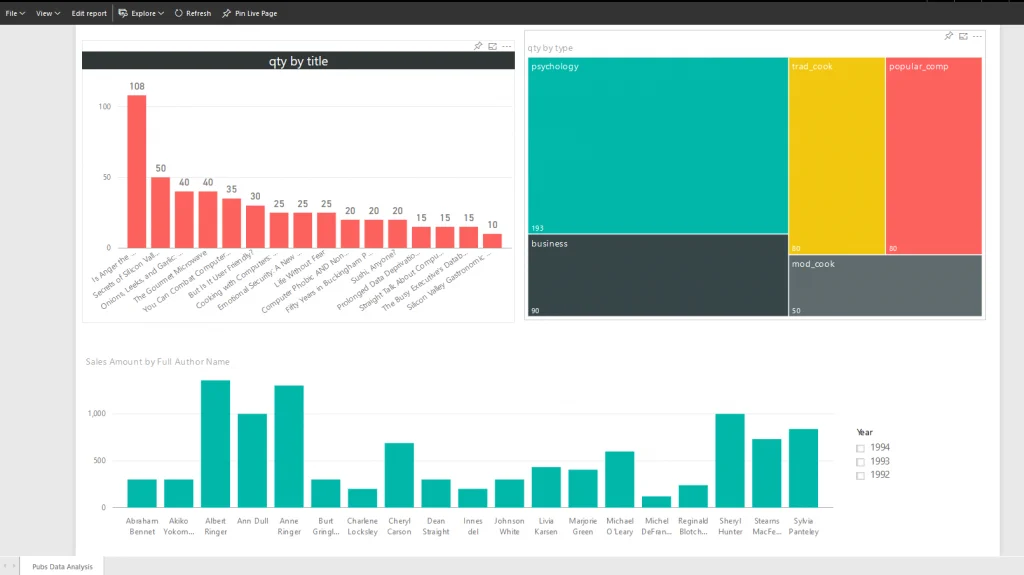
A Power BI report is a multi-perspective view into a dataset, with visuals that represent different findings and insights from that dataset. A report can have a single visual or pages full of visuals. Depending on your job role, you may be someone who designs reports. You also may be a business user who consumes or uses reports. This article is for business users.
In Simple terms Microsoft Power BI is a business intelligence (BI) platform that provides nontechnical business users with tools for aggregating, analyzing, visualizing and sharing data.
For more info, to know how you can Leverage our Microsoft 365 Skills for your Organization, please book a free consultation now: Discovery Meetings (office365.com)
One Comment
דירות דיסקרטיות באשקלון
I would like to thank you for the efforts youve put in penning this website. I really hope to check out the same high-grade content by you later on as well. In truth, your creative writing abilities has encouraged me to get my own website now 😉